The hottest day in recorded history has been observed worldwide

On July 22, 2024, the planet experienced the hottest day ever measured in modern climate records. The global average temperature reached about 17.15 degrees Celsius, or 62.87 degrees Fahrenheit. The number may sound modest, but it represents the combined air temperature across the entire world.
This record hottest day was not caused by one city or one summer day. It reflected a planet already warmed by climate change, with an El Niño pattern adding extra heat. The result was a remarkable milestone—and a warning about the direction of global temperatures.
The record day and the numbers behind it
According to the European Union’s Copernicus Climate Change Service, the global average surface air temperature on July 22, 2024, was approximately 17.15 degrees Celsius. Other analyses placed the value near 17.16 degrees Celsius. These small differences are normal because research groups use different methods and data sources.

The previous hottest day record was set only one day earlier, on July 21, 2024, when the average temperature reached about 17.09 degrees Celsius. The new mark also surpassed the earlier record of roughly 17.08 degrees Celsius, recorded on July 6, 2023.
In 2023, the first week of July produced several exceptional days. On July 3, the average global temperature passed 17 degrees Celsius for the first time in widely used daily datasets. Those records were later exceeded during the intense 2024 summer heat.
| Measurement | Record day | Earlier comparison | Reading value |
|---|---|---|---|
| Global surface air average | July 22, 2024 | July 21, 2024 | About 17.15°C / 62.87°F |
| Daily dataset milestone | July 3, 2023 | August 2016 monthly record | About 17.01°C |
| Monthly global average | July 2023 | Previous warmest July | About 0.3°C above the 1991–2020 average |
How scientists measure a global temperature
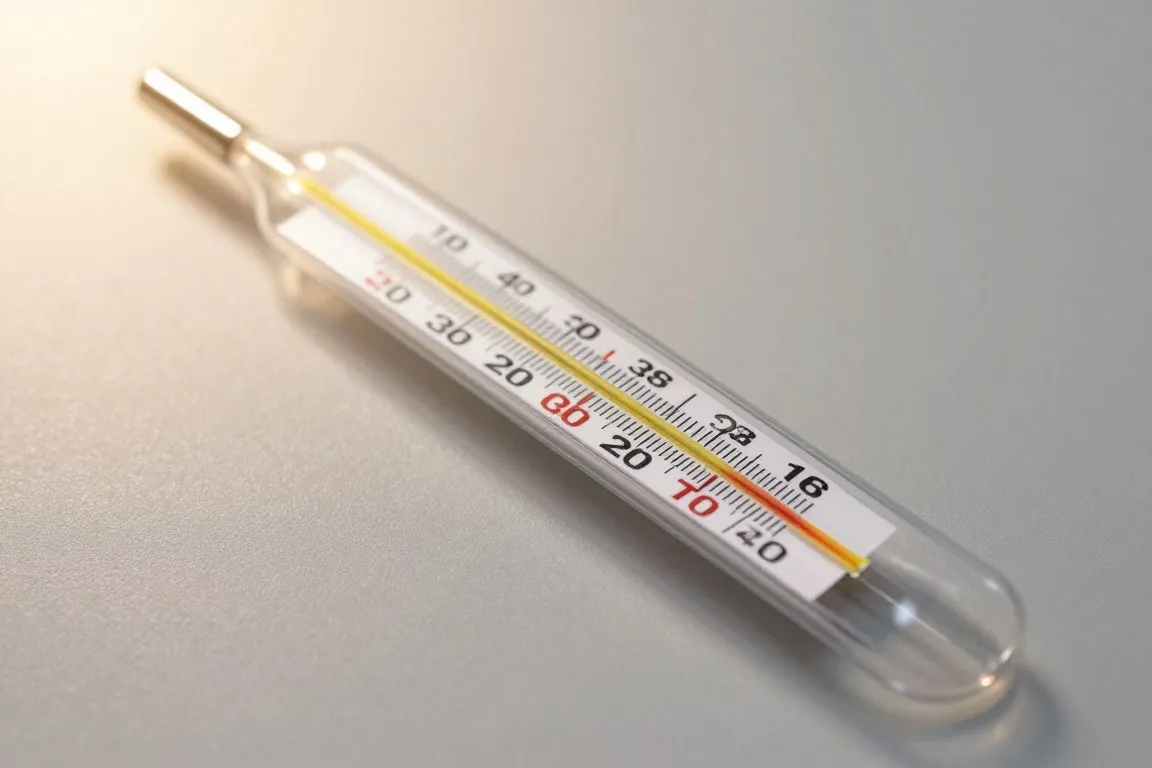
No thermometer sits at one exact point and measures the whole planet. Instead, scientists combine millions of observations from weather stations, ships, buoys, satellites, aircraft, and ocean instruments. Computer models then estimate conditions in areas with few direct observations.
Most daily records refer to surface air temperature. This means the temperature of air close to Earth’s surface, generally measured about two meters above land. Over oceans, researchers use sea-surface temperature observations and blend them with atmospheric data.
Different agencies can produce slightly different results. The U.S. National Centers for Environmental Prediction uses a global forecast and analysis system. NASA uses its own data-processing methods. Copernicus uses the ERA5 reanalysis, which combines observations with a detailed weather model.
These datasets are designed to identify broad patterns. They are not intended to describe the temperature outside every home. A local weather station may report a much higher or lower reading on the same day.
“Climate change is an ongoing process, and the increasing frequency of extreme heat events is one of its clearest signals.” — A summary of the position shared by climate scientists and major climate monitoring agencies

Climate change and natural heat working together
The main long-term driver is the rise in greenhouse gases. Burning coal, oil, and gas increases carbon dioxide in the atmosphere. These gases trap additional heat, raising the baseline temperature of the air, oceans, and land.
Natural climate patterns can then push temperatures higher for a time. El Niño is one example. During an El Niño event, unusually warm water develops across parts of the tropical Pacific Ocean. That warmth transfers energy into the atmosphere and influences weather around the world.
- Climate change raises the long-term average.
- El Niño adds a temporary warming effect.
- Ocean heat stores energy and releases it over time.
- Regional weather determines where the most dangerous heat occurs.
A single hottest day ever does not prove that every place was unusually hot. Still, the clustering of records is significant. The world has experienced a succession of record-warm months and years, while high temperatures are becoming more likely as the planet warms.
Heat risks for people and ecosystems
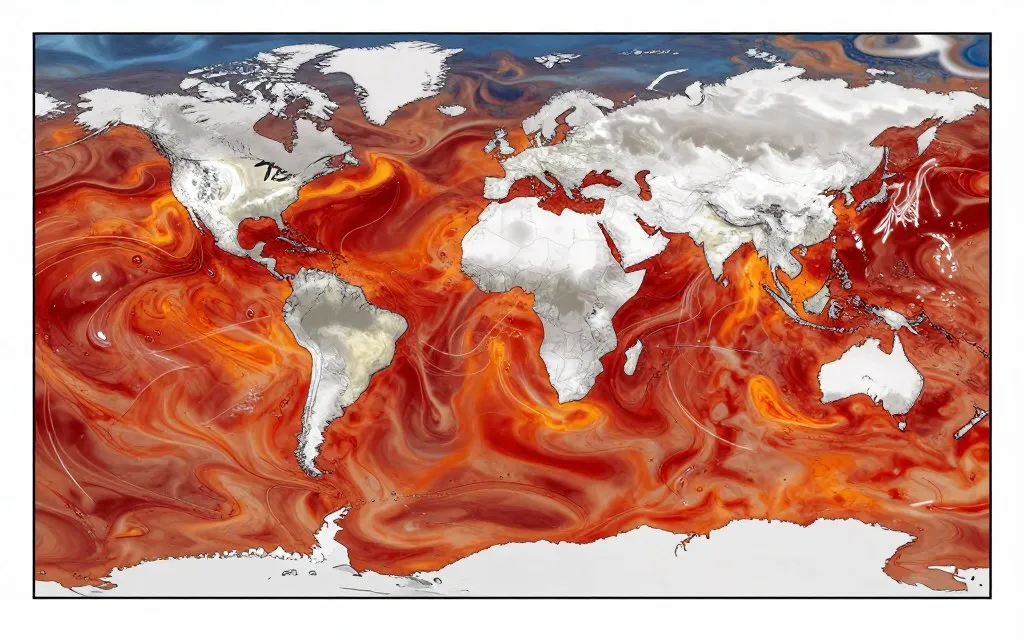
Global averages hide the sharp local effects of extreme heat. During the same period, parts of the Middle East, North Africa, Asia, Europe, and North America experienced dangerous temperatures. Some locations recorded temperatures above 45 degrees Celsius, or 113 degrees Fahrenheit.
High temperatures place stress on the human body. The risk rises when nights stay warm because people have less time to recover. Older adults, infants, outdoor workers, and people with heart or lung disease face especially serious danger.
Heat also affects the systems that support daily life:
- Electricity demand increases as air-conditioning use rises.
- Crops can lose yield when flowering occurs during extreme heat.
- Wildfire conditions worsen when vegetation becomes dry.
- Warm oceans threaten coral reefs and marine species.
- Water supplies face greater pressure during prolonged dry periods.

The hottest day in recorded history is best understood as part of a larger pattern. One day can attract media attention, but the deeper concern is the steady shift in the climate baseline. As global temperatures rise, record-breaking days become less unusual, and communities have less time to adapt.